Here at Sei Solutions we like to encourage companies and people to have a holistic view on data. Comparatively we also like to encourage a holistic view on the data analytics process itself. In our experience silo’ed analytics processes tend to be major bottlenecks in companies, and in this blogpost we are going to be looking at how we work to elevate the process and decrease the friction with project stakeholders.
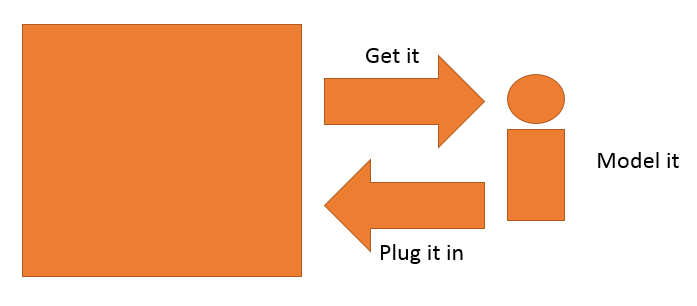
In the simplest of terms, an analytics project consists of three phases: Getting the data, modelling with the data, and pushing the results back in.
It’s easy for an analyst to claim that their main interest lies in the modelling part, and that the first and the third step aren’t or shouldn’t be of any concern to them. But we would like to argue the opposite:
Why involve yourself in data acquisition:
- You will get to be the judge of which data is of potential interest to the analysis, and in which format the data is of most use
- You might get the opportunity to pre-process the data before you put your hands on it (an example of this is presented below)
- You will save time during data exploration, since you’ve already acquainted yourself and have a good understanding of the data already
Why involve yourself in model deployment:
- You will be able to personally check that no mistakes are made while implementing the model
- You will be able to make on the fly adjustments to the model syntax whenever you encounter any unforeseen obstacles during the implementation
- You will get a better understanding of how the product will be used by the end user, which will help during the handover process
For example, this was the roadmap for data acquisition that we set up when we delivered a churn model to a client in a recent project:
Acquisition
- What data is available : Timestamp level transaction data for all customer
- How is the data stored : In a data warehouse, but it’s also available for download from Tableau
- How do we get access to the data : We downloaded it as .csv-files directly from Tableau
That last bit might have been a little controversial, but it enabled us to first pre-process the data into useful tables in Tableau instead of having to pull out the transaction level data from the data warehouse and process it ourselves in R. A typical example of how involving yourself in the acquisition process can simplify your work down the line.