Getting started with advanced analytics but don’t know where to start?
Most people would tell you to start with the data, but I’d rather say that you should start with the methodology.
As for why, I’ll present you with a piece of broken English:
Purpose in mind.
It’s a direct translation of the Swedish phrase “syfte i åtanke”, a bit of Swenglish if you please, and it’s a simple reminder to keep your goal in mind and your eyes on the road. Because in this age of bigger and faster data it’s easy to get overwhelmed by the scope and size of even the smallest projects, so it’s good to have a robust foundation to lean on.
One such foundation that we really like here at Sei Solutions is the analytics maturity chart:
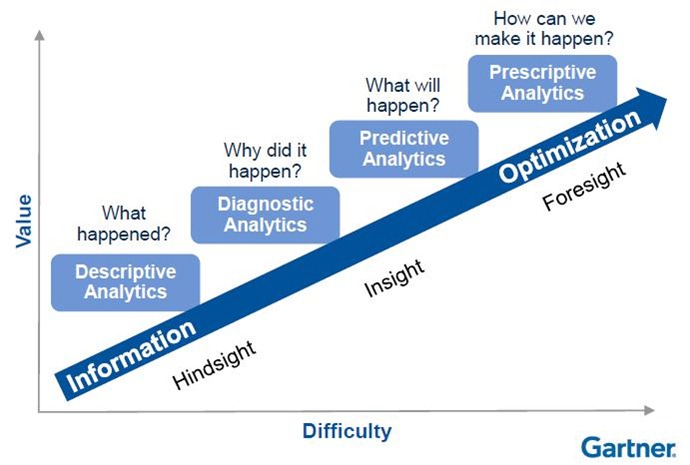
Coined by Gartner, but I remember first seeing it in an old IBM analytics zone blog post. But what does it tell us?
The maturity chart groups analytics work for organizations or parts of organizations into four distinct groups, simply described as:
– Descriptive analytics : using tables, graphs and other visuals aids you are able to describe what has been happening with your business lately
– Diagnostic analytics : using the same tools as descriptive analytics but putting it into a larger context, effectively diagnosing your business performance in relation to market trends
– Predictive analytics : using statistical modelling and machine learning algorithms to predict outcomes, and using this insight to prevent undesirable outcomes
– Prescriptive analytics : using these models and algorithms to anticipate where the market will go, and developing offers that can help steer the market into a more favorable place for you and your company
Every analytics department can put themselves somewhere on this chart. The goal is to move up in the maturity chart, to go from reactive to proactive analytics.
And that is, to us, what advanced analytics is all about.